Stock analysis & comparison using Python
Description
In this project, I performed a comparative stock analysis of two major companies using Python. I used Pandas for data handling, NumPy for numerical operations, and Matplotlib for visualization to examine recent stock price trends and evaluate each company’s performance relative to the broader market.
Stock Market Comparison Analysis:
Below is the process I am going to follow for the task of Stock Market Performance Analysis:
- Gather historical stock price data for the companies
- Create relevant features or variables that can help in the comparison
- Apply statistical methods to identify patterns or relationships between the stocks being compared.
- Compare the performance of the selected stocks against relevant benchmarks, like the S&P 500.
In this project, I set out to analyze and compare the stock market performance of two AI-focused companies that have recently caught my attention: Nvidia, the largest company by market capitalization, and Palantir, an AI-driven decision-making platform that has achieved an impressive 400% stock gain over the past year.
Please find the complete code and analysis here.
References:
Importing necessary libraries and downloading stock data
I will begin the Stock Market Comparison Analysis by gathering Apple’s and Google’s stock price data from the previous quarter, using the Yahoo Finance API as the data source.import pandas as pd
import matplotlib.pyplot as plt
import matplotlib.dates as mdates
import yfinance as yf
import numpy as np#defining the targeted stocks
palantir_ticker = 'PLTR'
nvidia_ticker = 'NVDA'
#defining the starting & end date
start_date = "2025-05-30"
end_date = "2025-09-15"
#downloading the data using the Yahoo finance API
palantir_data = yf.download(palantir_ticker, start_date, end_date)
nvidia_data = yf.download(nvidia_ticker, start_date, end_date)Descriptive statistics and visualization of stock prices
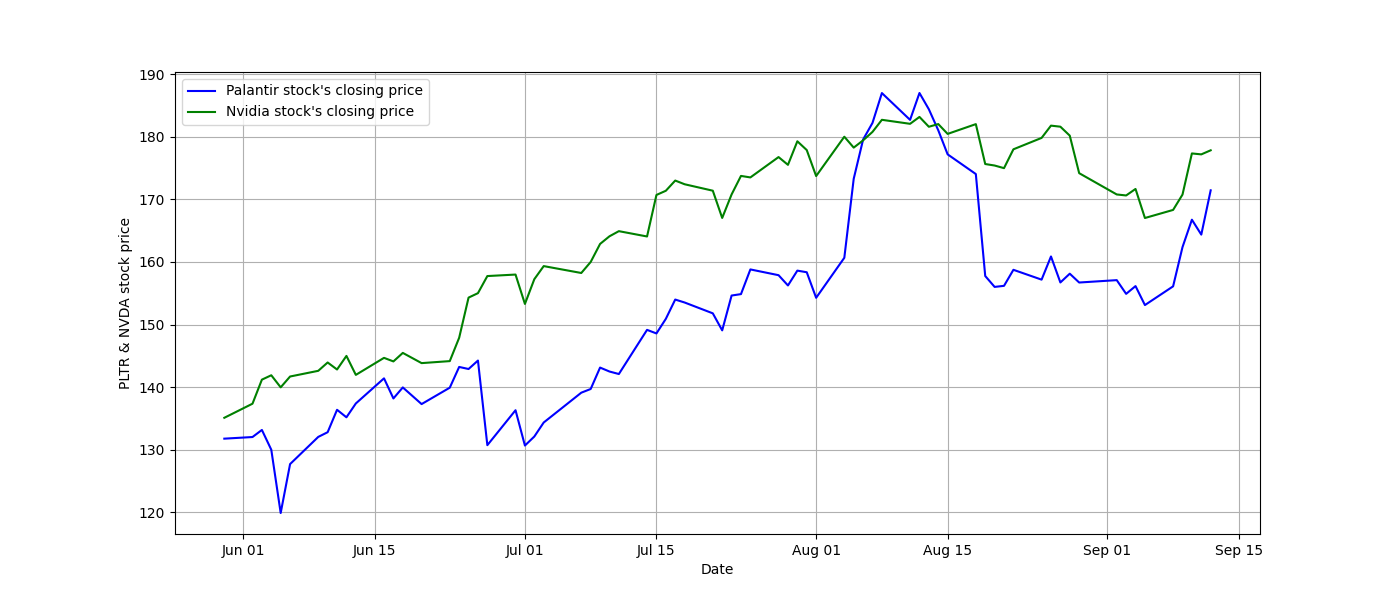
To better understand the dataset, I first performed an overview of its key characteristics. Specifically, I applied palantir_data.describe() to generate statistical summaries and used palantir_data.dtypes to inspect the column data types, ensuring that no type conversions were required. Finally, I graphed the closing price over the selected period to visualize its behavior.
#Overview of the dataset
print(palantir_data.describe(), palantir_data.dtypes)

#Visualizing the closing price of Palantir stock over the selected period
x_data = palantir_data.index
plt.figure(figsize=(14, 6))
plt.plot(x_data, palantir_data["Close"], color="blue", label = "Palantir stock's closing price")
plt.plot(x_data, nvidia_data["Close"], color="green", label = "Nvidia stock's closing price" )
plt.gca().xaxis.set_major_formatter(mdates.DateFormatter("%b %d"))
plt.gca().xaxis.set_major_locator(mdates.AutoDateLocator())
plt.xlabel("Date")
plt.ylabel("PLTR & NVDA stock price")
plt.legend(loc="upper left")
plt.grid(True)
plt.show()
Calculating daily returns, gain and volatility
The previously visualized data will serve as the foundation for various financial analyses and comparisons, including the calculation of returns, volatility, and other metrics to evaluate the performance and risk of these stocks.
First, I calculated the daily returns using the pct_change() method to determine the percentage change in Python. Then, I plotted the daily returns using matplot lib against the corresponding dates.
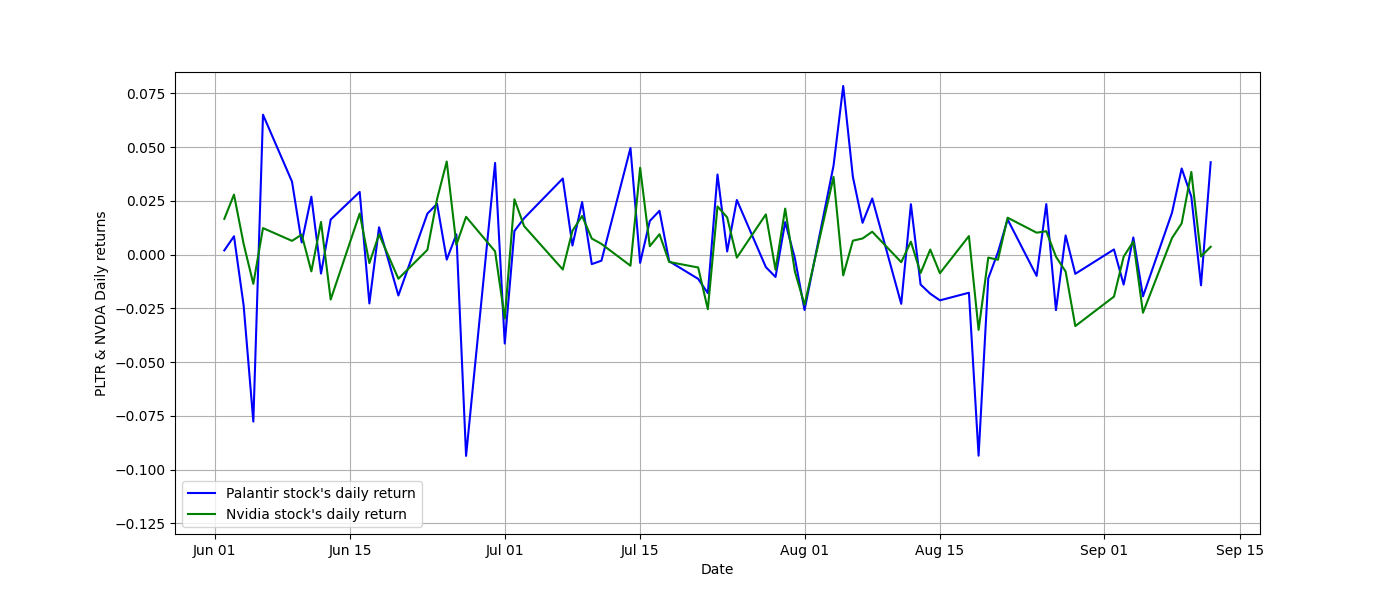
One noticeable observation is that Palantir’s stock fluctuates more than Nvidia’s. We can therefore infer that the standard deviation of Palantir’s daily returns is higher, indicating that Palantir’s stock is more volatile (see the definition of volatility). This observation will be confirmed by calculations in the following section.
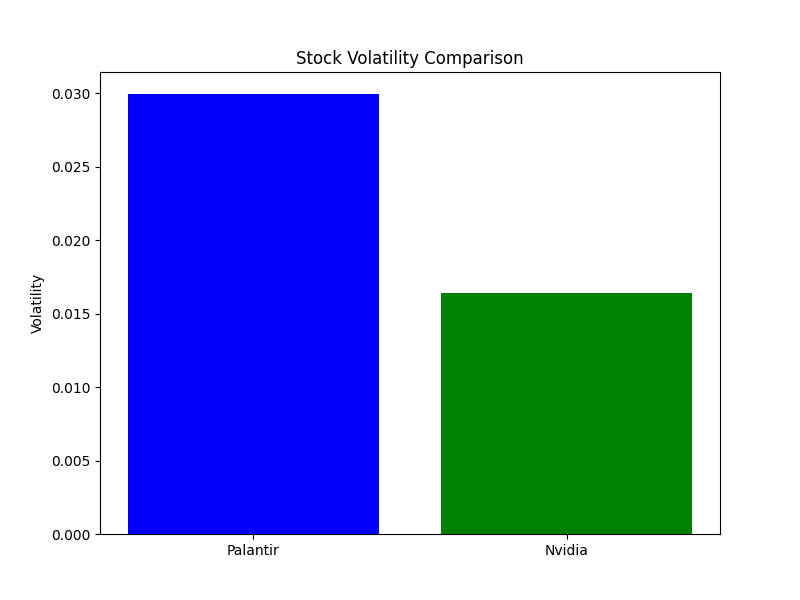
Using NumPy’s std() function, I calculated the volatility of both Palantir’s and Nvidia’s stocks based on their daily returns, and then visualized the results using box plots from Matplotlib.
Finally, we calculated the overall stock gain and obtained the following results: Palantir (PLTR) +30.09% and Nvidia (NVDA) +31.61%.
#Calculating daily returns From the 1st June to 15th September
palantir_data["Daily_return"] = palantir_data["Close"].pct_change()
nvidia_data["Daily_return"] = nvidia_data["Close"].pct_change()

#calculating volatility using the standard deviation of daily returns
volatility_palantir = np.std(palantir_data["Daily_return"])
volatility_nvidia = np.std(nvidia_data["Daily_return"])

#visualizing volatility using box plots
volatilities = [volatility_palantir, volatility_nvidia]
stocks = ["Palantir", "Nvidia"]

plt.figure(figsize=(8, 6))
plt.bar(stocks, volatilities, color=["blue", "green"])
plt.ylabel("Volatility")
plt.title("Stock Volatility Comparison")
plt.savefig(r"C:\Users\HP\Home\Documents\boxplot_volatility.png")
plt.show()

#Calculating stock gain using first & last price
first_price_stock_pltr, last_price_stock_pltr = palantir_data["Close"].iloc[0].squeeze(),  palantir_data["Close"].iloc[-1].squeeze()
palantir_stock_gain = ( last_price_stock_pltr / first_price_stock_pltr ) - 1

first_price_stock_nvda, last_price_stock_nvda = nvidia_data["Close"].iloc[0].squeeze(),  nvidia_data["Close"].iloc[-1].squeeze()
nvidia_stock_gain = ( last_price_stock_nvda / first_price_stock_nvda ) - 1

print( palantir_stock_gain_2,  nvidia_stock_gain_2)
Calculating beta values of the stocks compared to that of the market (S&P 500)
Finally, I calculated the beta values of the two stocks using the S&P 500 as the market benchmark. Beta is a statistical measure that indicates whether a stock is more or less volatile than the market as a whole. It is defined as the covariance between the stock and the market, divided by the variance of the market.
To calculate the beta values, I first downloaded the S&P 500 data using the Yahoo Finance API, then calculated its daily returns, and finally computed the beta values using the covariance and variance functions from Numpy.
The results of the beta calculation showed that Palantir has a beta of approximately 1.85, while Nvidia has a beta of about 1.57. This indicates that both stocks are more volatile than the overall market, with Palantir exhibiting higher sensitivity to market movements compared to Nvidia.
A beta greater than 1 suggests that a stock tends to be more volatile than the market. In this case, both Nvidia and Palantir have beta values greater than 1, indicating that they are expected to be more volatile and sensitive to market movements. Palantir’s higher beta value (1.85) compared to Nvidia’s (1.57) suggests that Palantir’s stock is estimated to have a higher degree of market sensitivity or risk compared to Nvidia.
#comparing the volatility of the pltr stock compared to that of the market ( s&p 500 )
sp500_ticker = "^GSPC"
market_data = yf.download(sp500_ticker, start_date, end_date)

#caluculating daily returns for the "market" & its volatility
market_data["Daily_return"] = market_data["Close"].pct_change()
market_volatility = np.std(market_data["Daily_return"])

#dropping na rows and putting the pltr, nvda and s&p500 return in one table
aligned = pd.concat([palantir_data["Daily_return"],nvidia_data["Daily_return"] , market_data["Daily_return"]], axis=1).dropna()
aligned.columns = ['pltr', 'nvda', 's&p']

#calculating the beta value for the pltr stock compared to that of the market in the following period ( 01-06 until 15-09 )
cov_pltr_market = np.cov( aligned['pltr'], aligned['s&p'] )
beta_pltr = cov_pltr_market[0, 1] / (market_volatility ** 2 )

#calculating the beta value for the pltr stock compared to that of the market in the following period ( 01-06 until 15-09 )
cov_nvda_market = np.cov( aligned['nvda'], aligned['s&p'] )
beta_nvda = cov_nvda_market[0, 1] / (market_volatility ** 2 )
Conclusion
This project demonstrates how Stock Market Comparison Analysis can be performed using Python. By analyzing and comparing Nvidia and Palantir’s recent stock performance against the market benchmark (S&P 500), I was able to evaluate their volatility, returns, and relative risk. Such analysis provides valuable insights into how different companies perform relative to each other and the broader market, helping investors and analysts make more informed financial decisions.